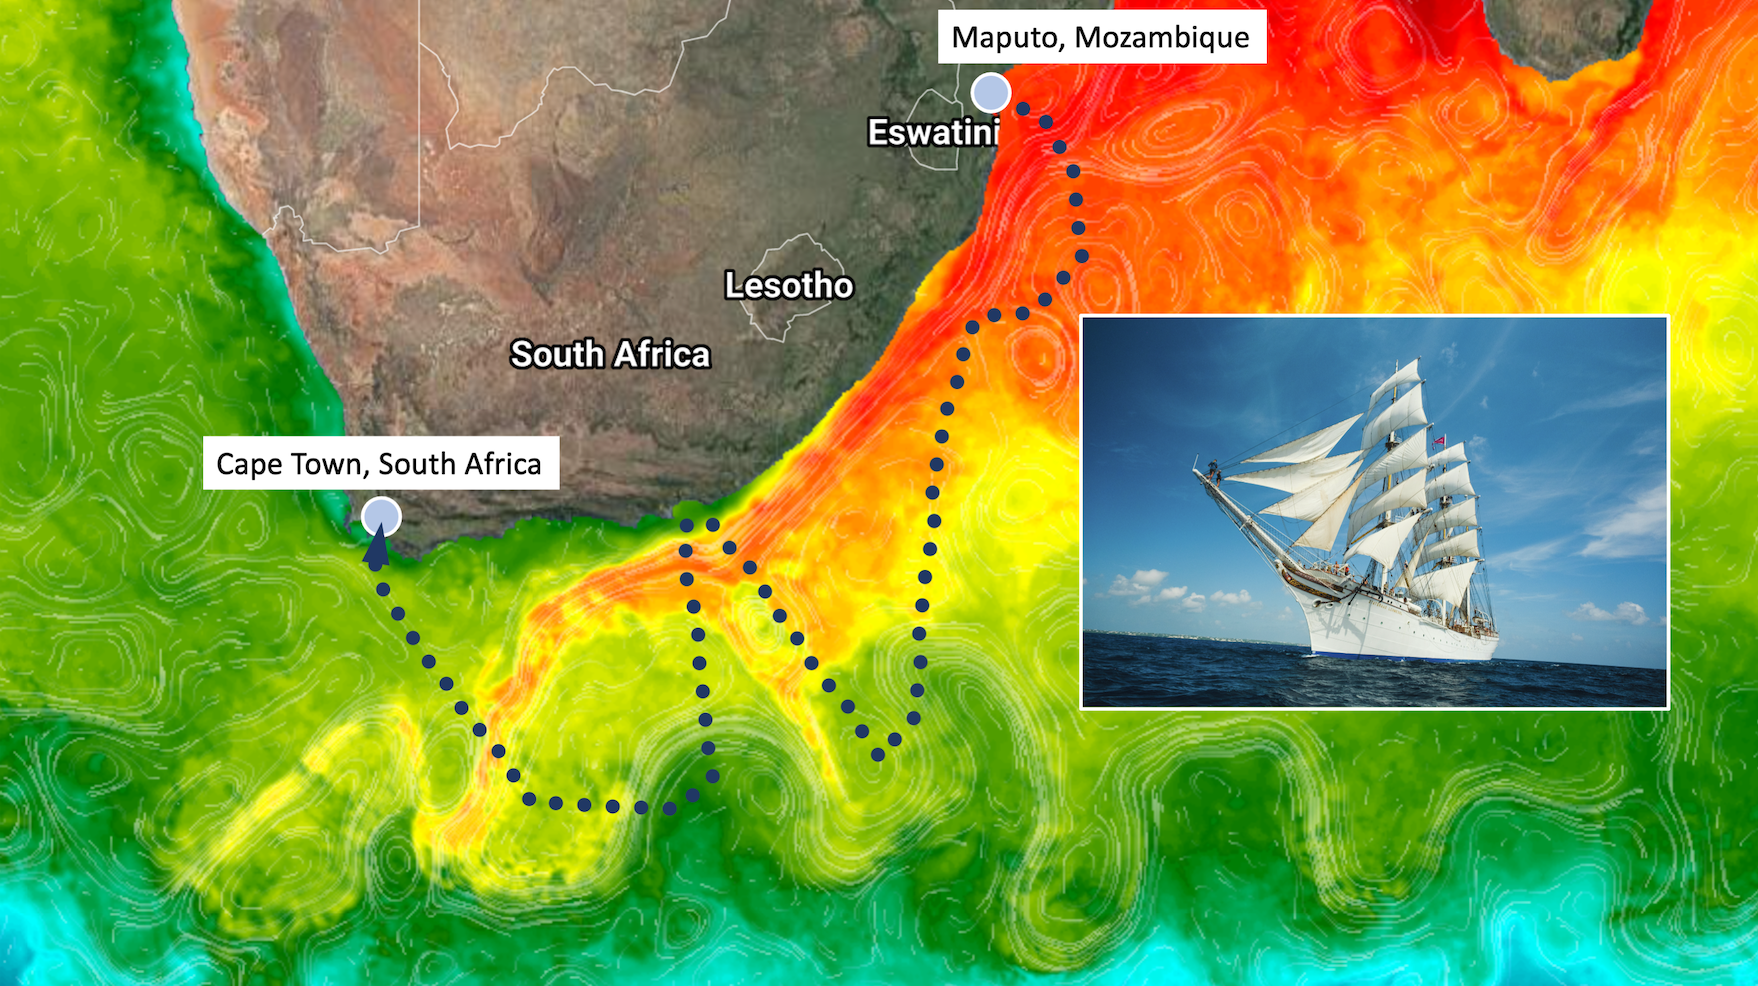
The online, shore-based Advanced Training on Ocean Synergy Remote Sensing course is designed to help students work with increasingly varied but complementary satellite data sets in synergy. The course will use a combination of standard and interactive lectures, together with the SEAScope synergy analysis tool (available free of charge for students to use after the course). There will be a focus on The Greater Agulhas Current Region, which will be used as an ocean laboratory to put what you learn in theory into practice. The interactive lectures are focused on specific areas of ocean synergy, and in addition, informal group work will enable students to bring to the course their ideas and needs for open informal discussion.
The course objectives are to:
- Train the next generation of Earth Observation Ocean Scientists,
- Explain the theoretical principles and application of Ocean Colour Radiometry, Infrared and Passive Microwave Radiometry, Biogeochemical, Sea Surface Temperature, Sea Surface Salinity retrievals, Synthetic Aperture Radar and Radar Altimetry;
- Introduce different satellites and their payload instruments;
- Explore data through hands-on exercises using SAR, Optical, Infrared, Passive Microwave, and Altimeter data, tools/toolboxes and methods for the exploitation of EO satellite data in synergy over the ocean;
- Stimulate and support the exploitation of the ESA Earth Explorer and Copernicus Sentinel Missions.
- Apply knowledge of satellite measurements in synergy to understand the character and dynamics of the Greater Agulhas Current Region Ocean Laboratory
- Develop skills to interpret satellite ocean data together with in situ ocean measurements to characterize and understand the environmental and climate change of the oceans.
- Develop a network of international students participating in the training course
Structure of the course
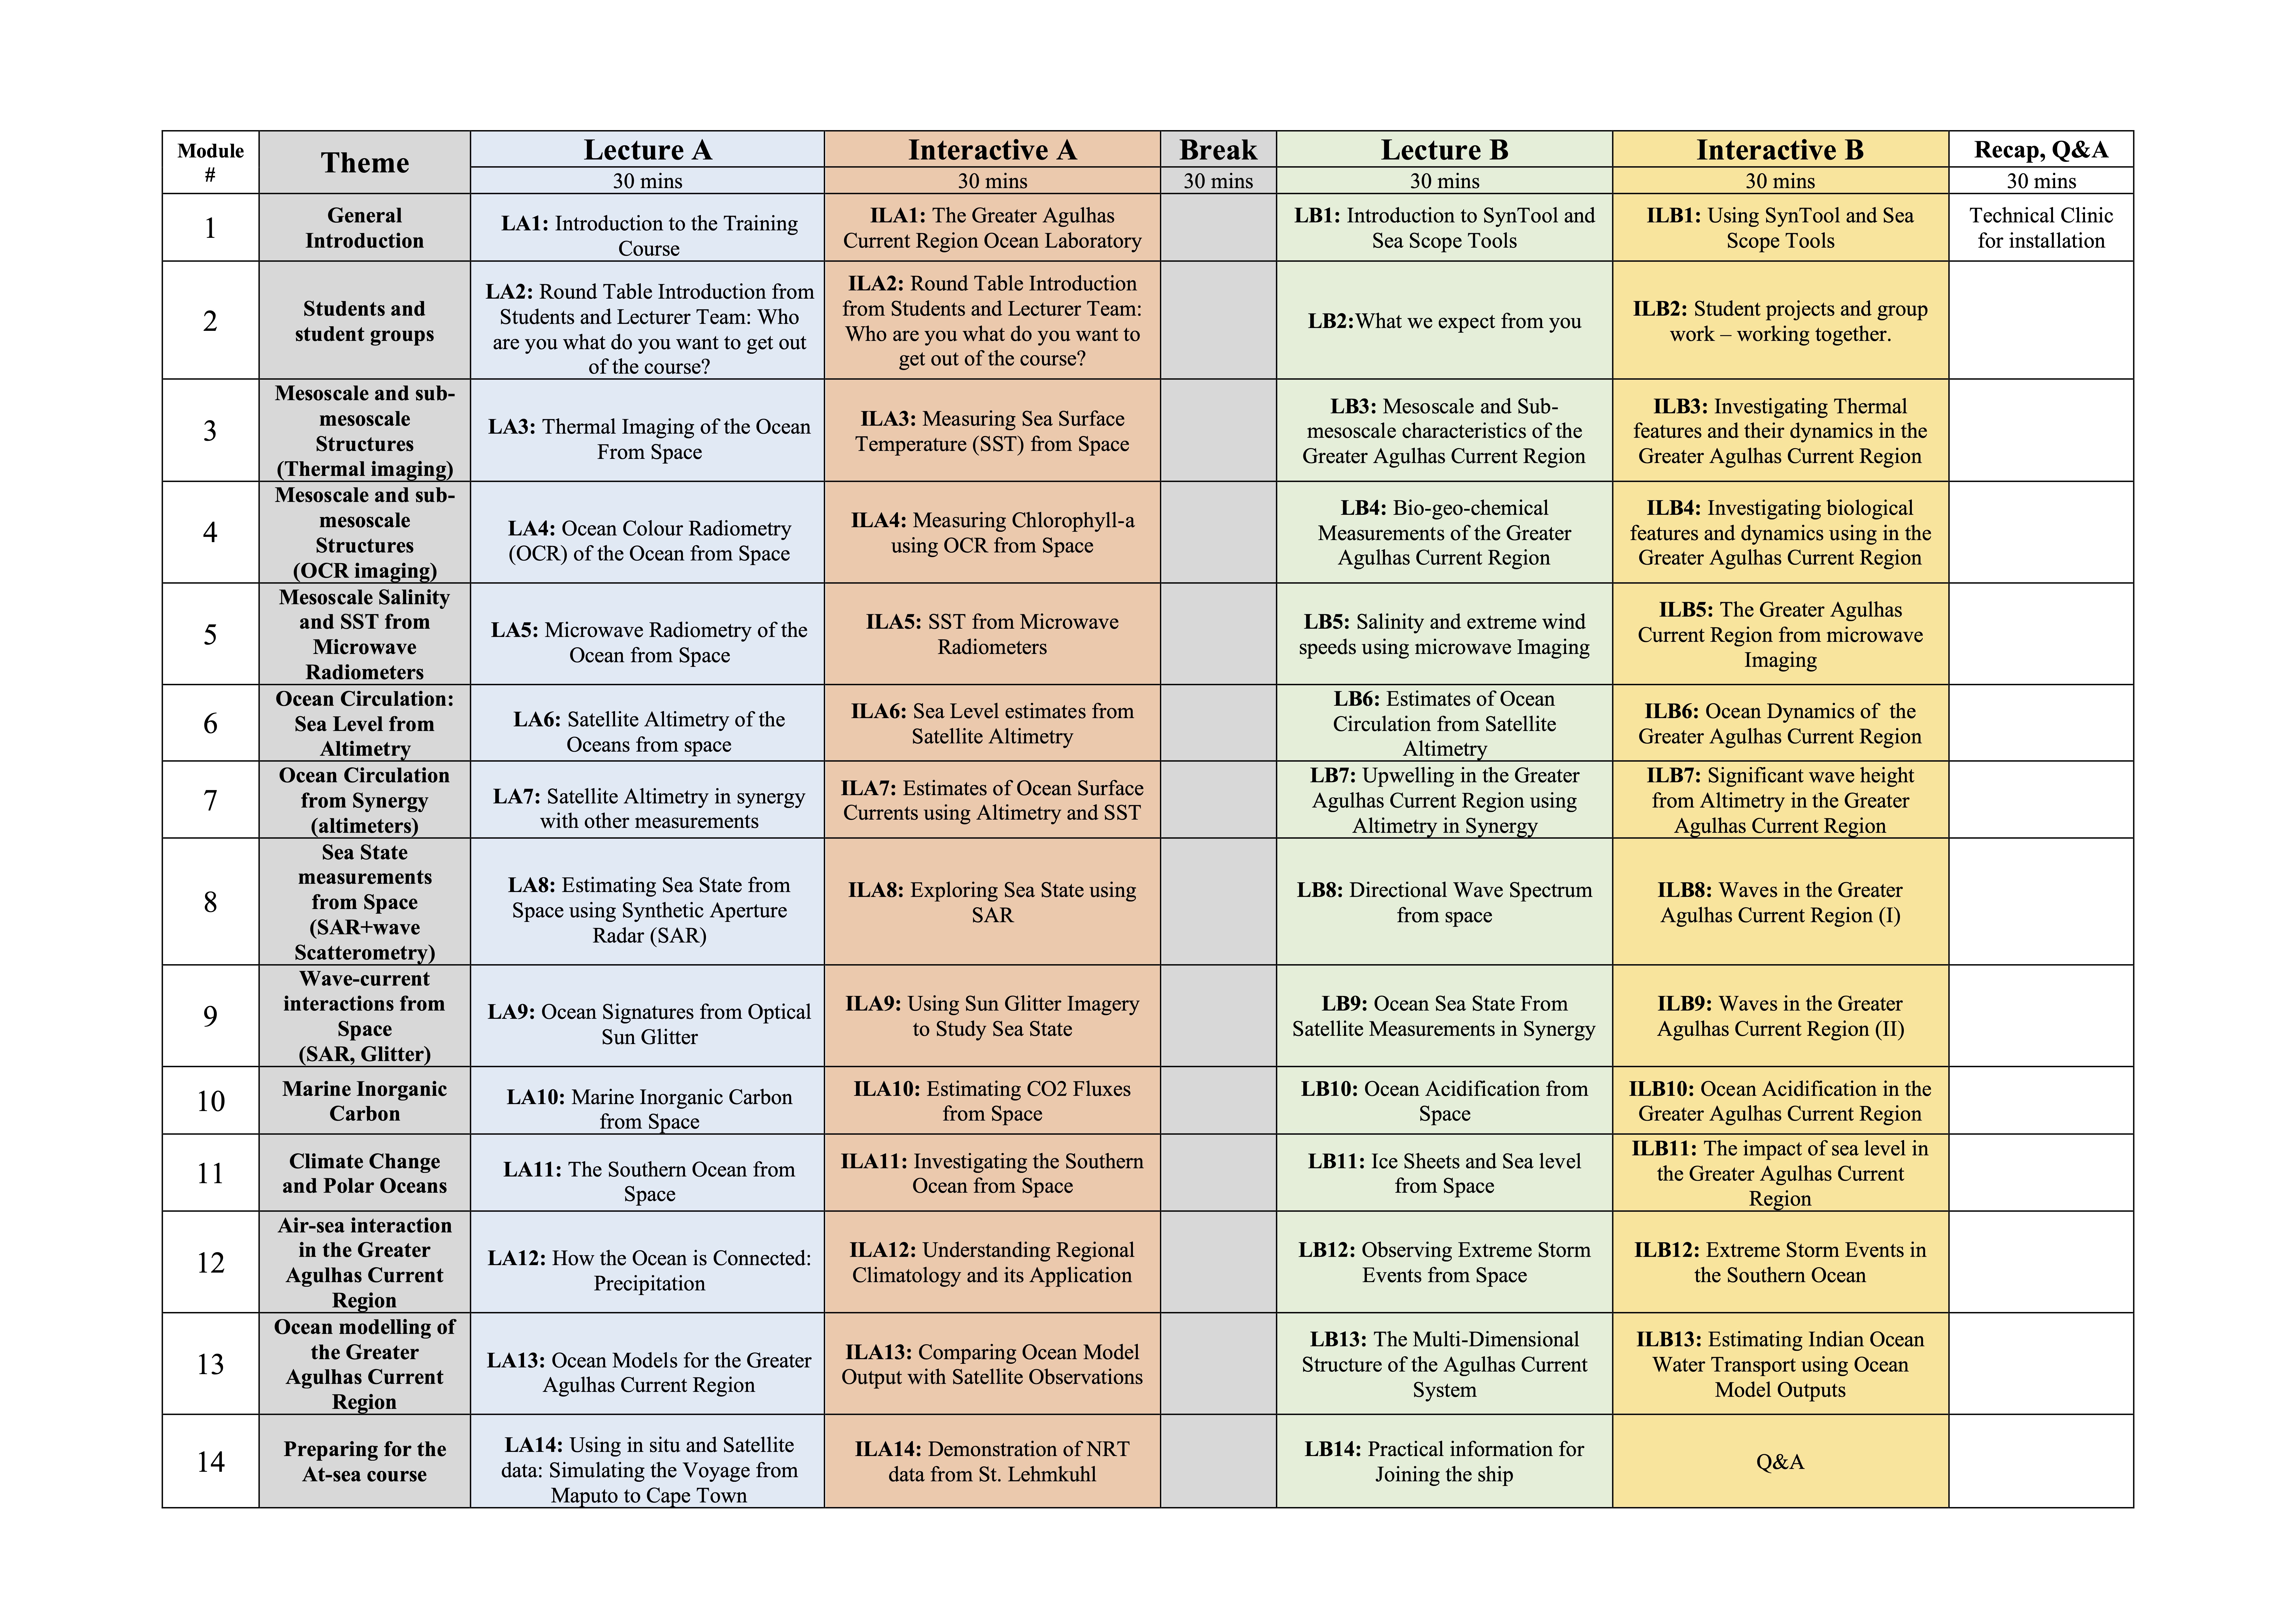
The draft timetable for the course is included below, it may be subject to further changes:

Lecture: A formal lecture given to introduce the subject
Interactive Lecture: a more informal style using interactive tools to handle data in a laboratory environment
Timing:
- Sessions will be held every Monday between 15:00-18:00 CET.
- Sessions will be held via WebEx.
- The first course session is planned on September 5th 2022 then every week afterwards, with the final lecture on the 5th December.
- Lectures will be recorded and will be available online afterwards.
Software and Tools
The course makes use of the Syntool Visualization Platform. This portal allows for highly attractive display and overlay of near real time satellite data together with in-situ data and model fields. Key variables we are interested in include: sea surface temperature, ocean color, surface geostrophic current, near surface wind and ocean waves. The selection of variables to be displayed is controlled by the "Products" menu located to the left. The date and time of selection is controlled by the lower horizontal panel. The viewing options of the Visualization Platform range from global to regional and offers a wide span of variable collocations and overlaying possibilities. Here, the position of the St. Lehmkuhl ship is visible on the portal, check under In Situ to find it! Moreover, surface drifter trajectories can be displayed on top of the near coincident SST, ocean color, surface roughness and surface current maps, clearly demonstrating the strength of this visualization tool both for research and dedicated applications. The visualization portal will also routinely be used for planning and execution of data collection during the sail-voyage, including deployment of surface buoys. For the course, we will use the standalone training module of the platform, known as the SEAScope Viewer that each participant will need to download.
